
AncestryDNA just doubled its ancestral regions, from 146 to 302. That number will get the headlines. The part I find more interesting is how they did it, because the method under your ethnicity estimate has changed more this year than in any update I can remember.
Ancestry published a white paper explaining the new approach. It’s thorough, and it’s also dense enough to make your eyes cross. So I did what I always do when the science gets thick: I drew a picture. Actually, eight of them.
Meet Sash.
Sash is a window. Not the kind you look out of, but a window into your DNA. By the end of this post, you’ll know exactly what Sash goes through on the way to your percentages, what changed in 2026, and why none of this has anything to do with your match list.
Meet the crew
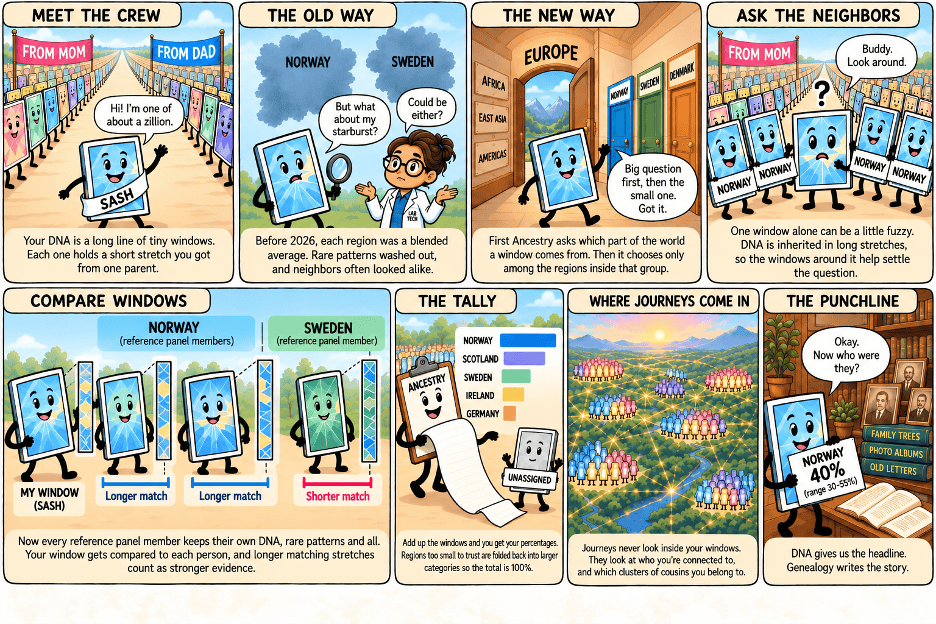
To estimate your ethnicity, Ancestry chops your DNA into thousands of small windows. Each window holds a short stretch of DNA, and thanks to Ancestry’s SideView technology, each window holds DNA from one parent.
That’s why the first panel shows two parade rows, one marching under a “From Mom” banner and one under “From Dad.” You have two copies of every chromosome, so you have two lines of windows.
Every window gets asked the same question: where does this little piece of DNA come from? Sash is just one of the crowd. Keep an eye on the little starburst in his glass. That’s his rare pattern, and it’s going to matter.
The old way: comparing Sash to a blend
Ancestry has always answered that origin question with a reference panel: a group of people whose DNA represents a particular place. If a window looks like the Norway panel, it gets labeled Norway.
Before 2026, Ancestry studied the panel and boiled each region down into a model of the DNA patterns common there. Your windows were compared to that summary, not to the people themselves. Think of it as a paint swatch. Mix together the DNA of thousands of Norwegians and you get one solid color labeled “Norway.”
Swatches are useful, but they have two problems, and the second panel shows both.
- Rare patterns wash out. If only some Norwegians carry Sash’s starburst, it disappears in the blend.
- Neighbors start to look alike. Norway and Sweden share a lot of history and a lot of DNA. Blend each one and you end up with two nearly identical shades of blue-gray.
Poor Sash holds his glass up between them and gets a shrug: “Could be either?”
Where the new reference panels come from
Before we get to the new comparison, we need to talk about who we are comparing against, and this is the part that had me asking my other very smart friends and Ancestry’s science team all my questions, because it gets a bit confusing.
You probably know about Ancestry’s Journeys feature. It shows where your ancestors may have been in the last 300 years and it is VERY useful for genealogy. This is the feature that tells you about migrations: groups of testers who share so many matches with each other that they almost certainly descend from a common group of people. Ancestry has found more than 4,500 of these networks. This Journeys product feature is based on Ancestry’s Genetic Communities technology. I know, I know, this is the first part of the confusion. Just keep holding on to the distinction: Journeys are a product feature and Genetic Communities are actually a technology. The Genetic Communities technology relies on finding networks of individuals who are DNA matches.
In 2026, those Genetic Communities became the starting point for building many of the reference panels for the new Regions. Ancestry looks at a network, then filters its members down to the people who best represent a single place:
- Keep people who are strongly connected to the network.
- Drop people who also belong to networks from different populations. Half Irish and half Italian? You’re a great tester, but a confusing reference sample.
- Check their existing region results and drop anyone with too much DNA from elsewhere. (Some is allowed when history explains it. Many people with deep roots in southeastern England carry 3 to 5 percent Scandinavian, courtesy of the Vikings.)
- Drop people who are more connected to outside networks than to this one.
- Map the birthplaces of their ancestors from family trees and confirm they cluster where they should.
The result is a panel of more than 295,000 people, up from about 185,000. In parts of the world where Ancestry doesn’t have enough customers yet, the panels still come from research collections like the Human Genome Diversity Project and the 1000 Genomes Project.
The new way: comparing Sash to real people
Here’s the heart of the 2026 update. Ancestry threw out the swatches in the regions that now have enough reference samples for this new technology.
Now each of your windows is compared directly to the DNA of individual panel members in that same window. Look at the “Compare windows” panel. Every window in the lineup has different glass, because every real person carries their own patterns, rare ones included.
Ancestry measures how long a stretch of Sash’s DNA is identical to each person’s. Longer stretches count as stronger evidence, because DNA gets chopped into smaller pieces every generation. A long identical stretch points to a more recent shared ancestor in that spot; a short one points further back.
And look who else has a starburst. Several Norway windows carry the same rare pattern as Sash, and their stretches run longest. One Sweden window has it too, just with a shorter stretch. That’s real life: populations overlap. No single comparison decides anything. The evidence from many people gets pooled into a probability for each region.
This is the most important idea in the white paper, so I’ll say it plainly: instead of comparing you to the average Norwegian, Ancestry now compares you to thousands of individual Norwegians, rare patterns and all. That’s how it can tell apart neighbors that used to look the same, and it’s a big reason the region count could double.
These are not your matches
I know what some of you are thinking, because I thought it too. If Ancestry is comparing my DNA to real people and measuring shared stretches… isn’t that just matching?
Same ruler, very different job.
- A DNA match looks across your whole genome for long shared segments, at least about 8 cM at Ancestry. Long segments mean a recent common ancestor, someone you might find in your tree.
- A matching stretch in a window is tiny, often far too small to ever show up as a match. It reflects shared ancestry hundreds or thousands of years back, the kind you share with huge numbers of people from the same population.
The people in Sash’s lineup are strangers. They aren’t cousins, and the method doesn’t need them to be. They just carry patterns that are common where their ancestors lived.
One more thing, because I can already see the emails coming: this update does not make the small segments on your match list more meaningful. A 5 cM match is exactly as unreliable today as it was last month.
Two doors, and a little help from the neighbors
Comparing every window against all 302 regions at once would be slow, and it would make the fine distinctions harder. England alone has six neighboring regions. Nigeria has eight. Mexico has fifteen.
So Sash walks through two doors. The first is a big one: which part of the world does this window come from? Europe, Africa, East Asia, the Americas, and so on. Only then does he reach the hallway of smaller doors and ask, which region inside Europe? Choosing among close neighbors is much easier once you’ve ruled out everyone else.
Even then, a single window can be fuzzy. Some windows look equally Norwegian and Swedish. That’s where the “Ask the neighbors” panel comes in. DNA is inherited in long stretches, so the windows on either side of Sash usually share his origin. If they’re all wearing Norway tags, Sash probably is too.
Ancestry used to handle this step with a statistical model that tidied up the sequence of guesses. In 2026, it uses an AI model from the same family behind today’s large language models. The idea is the same one you use when reading a smudged word in a sentence: the context tells you what it probably says.
One more cleanup step happens here. Sometimes Mom’s DNA and Dad’s DNA get swapped partway down a chromosome, which would make your parents’ regions abruptly trade places. Ancestry catches those switches and puts each window back in the right row.
The tally: from windows to percentages
Once every window has a region for each parent, the Clipboard (Sash’s tally) walks the parade and adds it up. For each region, Ancestry totals the length of the windows assigned to it, divides by the length of your whole genome, and combines Mom’s row with Dad’s.
A few things happen in this step that explain results people often find puzzling:
- Tiny regions get dropped. Some windows land on very unlikely regions, which is mostly noise. Ancestry only reports regions above a minimum share and spreads the rest among the regions it does report, so the total comes to 100%.
- That’s why you’ll see “Unassigned” in your chromosome painter. Those are the windows whose low-confidence regions got folded back in. Ancestry doesn’t track exactly where each one went, so it leaves them unlabeled.
- Small regions can appear and disappear between updates. A region sitting right at that minimum can slip above or below it with almost no change in the underlying evidence. If your 2% Sardinia vanishes, your DNA didn’t change. It just landed on the other side of the line.
- Ranges tell you how much to trust a number. Each region comes with a range, like 40% (range 30–55%). Ancestry builds those ranges by testing the method on simulated people whose ancestry is known. Distinctive regions get narrow ranges. Regions that look a lot like their neighbors get wide ones.
So how are regions and journeys different now?
If journeys help build the regions, you might wonder whether the two features are merging. They aren’t. They still answer different questions.
- Journeys ask: who are you connected to? They never look inside your windows. They look at the web of who shares DNA with whom and find the clusters you sit inside. You’re either in a journey or you’re not. No percentages. What you get is belonging and a story of movement, usually within the reach of your family tree.
- Regions ask: whose DNA does yours resemble, piece by piece? They look at every window, compare it to a labeled panel, and add the results up into percentages.
So why can only some of those 4,500 networks become regions? It’s mostly about time. A network forms quickly. A few generations of families putting down roots in the same county is plenty. But a region needs a group whose DNA has become recognizably different from its neighbors, and that takes many generations of marrying mostly within the group. Descendants of 1800s settlers in Tennessee make a great journey, but window by window their DNA still looks English, Scots-Irish, and German.
Groups like the Acadians, the Québécois, and Germans in Russia are the opposite case. Centuries of relative isolation gave them a shared genetic signature, which is why they could become regions (they were added in the 2025 update). Their journeys didn’t have to disappear for that to happen. You can carry the signature and belong to the story.
One caution for those of you with roots in the Americas. Many of the new regions have names like “Atlantic Northeast (Canada & USA)” or “Gulf Coast & Mississippi Basin (USA).” They sound like colonial migration journeys, but they aren’t. For these regions, Ancestry builds the panel from only the Indigenous-inherited portions of people’s DNA. If your Atlantic Northeast roots are all Puritans, that’s not what this region is describing.
Here’s how I’d sum it up: a journey is a group’s story; a region is a group’s signature.
The punchline
In the last panel, Sash finally gets his result card: Norway, 40%. He doesn’t celebrate. He turns toward the bookshelf full of family trees, photo albums, and old letters and asks the only question that matters: “Okay. Now who were they?”
That’s the right instinct. The 2026 update makes your ethnicity estimate sharper, and that’s worth exploring. But a percentage is a description of your DNA, not a list of your ancestors. To find them, you still need your matches, your shared matches, and your tree.
DNA gives us the headline. Genealogy writes the story.

