DNA ethnicity estimates are more reliable for certain locations than others. Here’s which regions of Europe are more (and less) likely to be identified correctly.
 Here’s a great word: allele [uh-leel].
It refers to a specific physical location on a chromosome that can take different forms due to mutation. Each of the different forms are called alleles. Currently autosomal ethnicity tests are powered by genetic markers called SNPs (Single Nucleotide Polymorphism), which are individually a specific single-point position in the human genome that can present different alleles: A, T, C or G. Each client is tested on 700,000 different SNPs to generate their DNA profile, which the companies compare to reference panels for estimating their ethnicity proportions.
In companies’ internal validations, they are interested in regionally-specific performance and find that some regions are more robust for correctly recognizing client DNA that belongs there, while others are more prone to misassignment. Among many other factors, one that leads some regions to perform better than others in this way is the presence of private alleles.
Private alleles and DNA testing
A private allele is one that occurs only in a certain population– it is completely absent anywhere else in the world. Some populations over time have remained isolated, either geographically or culturally, and as a result accumulate many private alleles that are specific to just their population and are not found elsewhere. When a population accumulates many private alleles this makes it genetically distinct from others around the world. As a result it’s easy to identify a member of that population just by looking at their genetics because they tend to possess those private alleles that are absent everywhere else. Pretty handy when those private alleles show up, right?
There is a classic collection of carefully selected populations from which scientists curated samples in the early 1990s in part due to their isolation, and thus their distinct genetic signatures. Among 52 sampled populations world-wide are the Burusho, a linguistically isolated group in Pakistan; Orcadians, the indigenous inhabitants of the Orkney Islands; the Hezhen, an ethnic population of 4,600 in China; the Biaka, a nomadic pygmy people of Central Africa; and the Karitiana, an indigenous population of Brazil with just 320 members. Each of these 52 populations show strong genetic distinctiveness from one another, and this is due in part to a large proportion of private alleles in each population.
“Cosmopolitan DNA”
Today with a world population of over 7 billion, the majority of us belong to populations with more cosmopolitan genetic characteristics, meaning our individual genetic signatures are compilations of DNA from many different countries. Rather than most of us coming from parentage that has been generationally restricted to a single region or tribe, in recent generations, populations that were formerly more isolated have come together in us. Many of us as individuals carry ancestry from all around the world. And that means that there is not an abundance of private alleles floating around in our genetic makeup. When we descend from a pluralistic world of increasingly mixed ancestry, we are less genetically distinct from one another. I think that’s beautiful.
One of the great challenges of developing an ethnicity test for all of us cosmopolitan clients, is to still be able to draw out historic genetic distinctiveness even when there are not many instances of genetic markers that are clearly exclusive. Overall this is still possible because even though alleles do not remain private when different populations mix, they still tend to show up at different frequencies across regions. Some cosmopolitan alleles are found all over large areas and across continents, but they are much more common in their origin geography and have decreasing frequency when moving away from the epicenter of their origin. Allele frequencies, rather than the presence or absence of exclusive alleles, become a genetic fingerprint for each population that is detectable in clients querying their ancestry.
Accuracy from continent to country
23andMe reports near-perfect precision/recall numbers at the continental level for correctly inferring ancestral origin. Think about it intuitively: individuals from different continents have been physically, culturally, and genetically separated for a long time, thereby accumulating many distinguishing characteristics. But those who live more closely to each other, perhaps in neighboring countries or regions, are more likely to mix genetically, and therefore to become more genetically similar over time. In fact, 23andMe found that when trying to identify national and regional ethnicities, accuracy tends to decline.
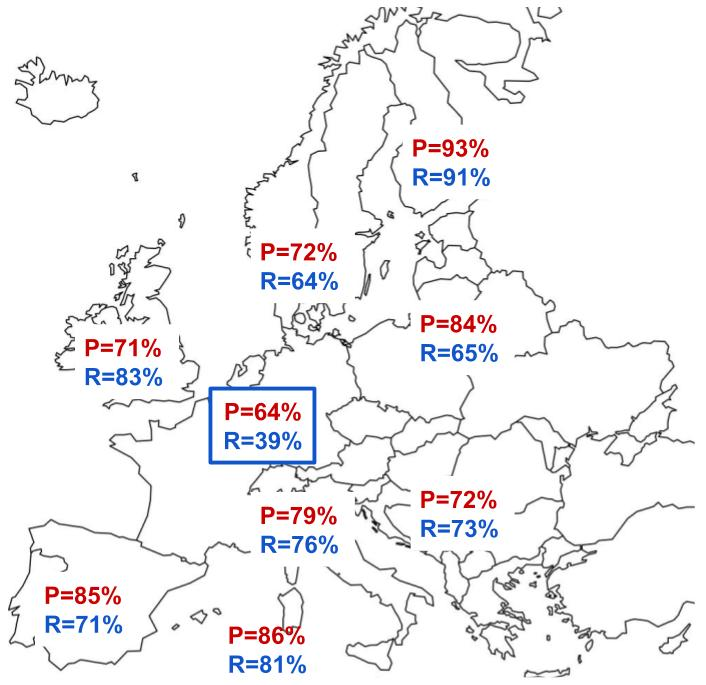
Region-specific precision/recall numbers reported by 23andMe are telling for trends in Europe that may also be seen elsewhere in the world:

The above statistics show how reliable ancestral ethnicity designations are across European groupings. Precision is reported in red and recall in blue; the important thing to remember here is that the higher the percentage, the more reliable is 23andMe’s ability to correctly distinguish ancestral ethnicity in individuals at the national level within the European continent.
Finland, being geographically and linguistically isolated, gives a robust performance with metrics greater than 90%, which can likely be attributed to a higher frequency of relatively private alleles accumulated by this population. Other geographies show some decreased performance but many still have strong numbers (greater than 80%). The most notable dip in performance is seen in the centrally located France/Germany grouping with an unusually low recall at 39%. This means that 61% of assignments that should have been designated to France/Germany were mistakenly assigned elsewhere. That’s a large percentage of misassignment, and the lowest for performance in Europe for this particular test.
Trends can be recognized from this data. Countries on the periphery of the continent tend to have stronger performance numbers indicating genetic distinctiveness, while those that are more interconnected, cross-roads nations display genetic characteristics that are less private and more cosmopolitan. The genetics of centrally-located Germany suggest that this is an area that has been subject to extended DNA sharing with other regions over a long period, more so than other peripheral populations in Europe. By this analysis, this central European region is likely to have a lower instance of private alleles, and probably shares similar frequencies of more cosmopolitan allleles with other countries.
The limits of ancestral ethnicity detection
This may seem like bad news if central European ancestry is applicable to you. It could be. What we may be seeing is that given the regional characteristics, we are approaching the limit of resolution for detecting this specific level of ancestry using the current genetic markers and algorithms. Are we really seeing the limits to this technology? Are there any improvements that may push for more successful and specific geographic predictions?
Of course there are some very specific ancestry predictions that are coming out of companies like Living DNA that purport to “breakdown your ancestry with unrivalled worldwide regional and sub-regional detail.” This is in part because their proprietary DNA collections that make up their reference panels may have more extensive coverage in regions of high interest (Living DNA in part has a sub-regional UK focus, but currently doesn’t publish the details of how they select samples to represent a region or the number of samples representing each).
Getting more robust reference populations can help, but the fundamental fact is that historic DNA sharing between related populations lowers the occurrence of those private alleles and, over time, moves toward allele frequencies that are indistinct from one another. Living DNA does not currently publish performance metrics for these specific sub-regional groupings, but this would help paying clients and the community as a whole to understand the reliability of these predictions, and where the ceiling of resolution is for this technology in its current form.
Beyond increasing the numbers and targeting specific geographies for sampling that are currently underrepresented, other possible refinements may extend the limits of detecting fine-scale ancestry. As new computational methods are developed, algorithms are adjusted. Recently, some companies have revised which genetic markers they use, as they recognize that some are better for distinguishing world populations. And there are inevitable changes on the horizon as we move toward an era where Whole Genome Sequencing will become increasingly accessible.
 In fact, that’s actually the next topic in this DNA ethnicity series: Whole Genome Sequencing: Will You Do It? It’s now available and relatively affordable, but “what you get” from it is still in its infancy. Is it worth it?
And for deeper exploration into your ethnicity results, take a look at our free guide on DNA ethnicity estimates!

