DNA ethnicity estimates are within your hands to understand—look at confidence levels as closely as you do the pie chart itself!
This is the third article in a series exploring DNA ethnicity estimates in depth. You’ll find links to the first two articles at the bottom of the page.
 I was a little bit nervous when I opened up my ethnicity report for the first time. What would it say about me? Something totally unexpected? Maybe it would confirm what my lactose-tolerant, prone-to-sunburn, light-eyed reflection suggests to me everyday when I look in the mirror: Northern Europe all the way. Deep breath, log in, wait for the page to load…and a splash screen with an authoritative-looking table pronouncing exactly how my ancestry divvies up to the tenth of a percent. Really? I’m exactly 22.6% from Ireland and Scotland? And what about that 3.4% Germanic Europe? I don’t have any known family history in Germany– is it time to launch a full scale inquiry into my long-lost German forebear?
Despite the implicit authority we tend to give to something with a scientific stamp on it, there is good reason to regard ethnicity estimations as a fluid appraisal of trends contained in our DNA, rather than a literal statement of fact. Communicating this to the public is something that all companies can improve in their marketing of ancestry products and results presentation. Many clients come to ancestry testing primarily curious about their ethnicity estimations and are ready for truth to be revealed to them.
Unfortunately for all of us, one of the key pieces in interpreting those ethnicity proportions is decidedly underplayed in reporting. Or it’s so buried in a maze of circuitous clicks that many clients don’t find it at all. It’s a supremely important concept for all of us with an ethnicity report in hand: CONFIDENCE LEVEL!
How “confident” are those DNA ethnicity reports?
Did you know that every percentage in your ethnicity report has a confidence rating associated with it? What does it mean? Let’s look at it.

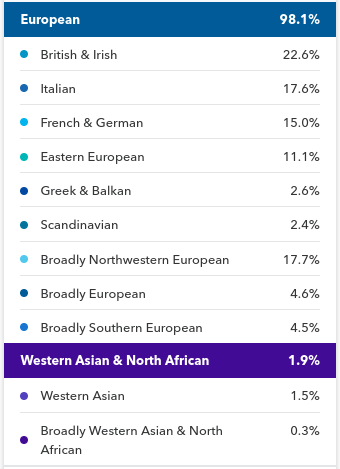
The above 23andMe client went into testing expecting to see ¼ Italian, a substantial proportion of British Isles, and some Eastern Europe. The results show a good signal for all of these, along with some other interesting geographies too. A key piece in interpreting these results– confidence level–is not directly given in 23andMe reports. After examining several paragraphs of 6-point font, and 2 page clicks from the initial report, I was able to access the confidence level data for this ethnicity report.
Here, clients learn that the default threshold for an ancestral geography to be reported is 50% confidence. By definition this means 50-50, the predictions on this table are as likely to be right as they are to be totally wrong. Come again? What was that? The default setting on 23andMe reports is 50% confidence– the figures are as likely to reflect accurate ancestral origins as they are to report something quite spurious.
Well, that’s good to know. So that funny 4.8% Norway on my report when my family has no Scandinavian ancestry might not mean anything? Yes, statistically speaking, it’s as likely to be a bogus signal as it is to be meaningful. How about all the other numbers that do seem concordant with the ancestral geographies I was expecting? Are they suspect too? In a way, yes, at this level of confidence we should regard all estimations derived from DNA data as being equally meaningful and equally insignificant.
All along the confidence level spectrum
The term that 23andMe uses for this default level of confidence in its reports is speculative, explicitly meaning that the reported ethnicity proportions are expressions of an opinion without sufficient proof, the product of conjecture, or a good guess. One of the very useful aspects of the 23andMe report is that clients can adjust the confidence setting in increments between 50%-90% to see how it changes their ancestry proportions. At the 90% confidence level, 23andMe terms the results as conservative, meaning they are cautiously moderate or purposefully restrained from reporting figures without sufficient evidence.
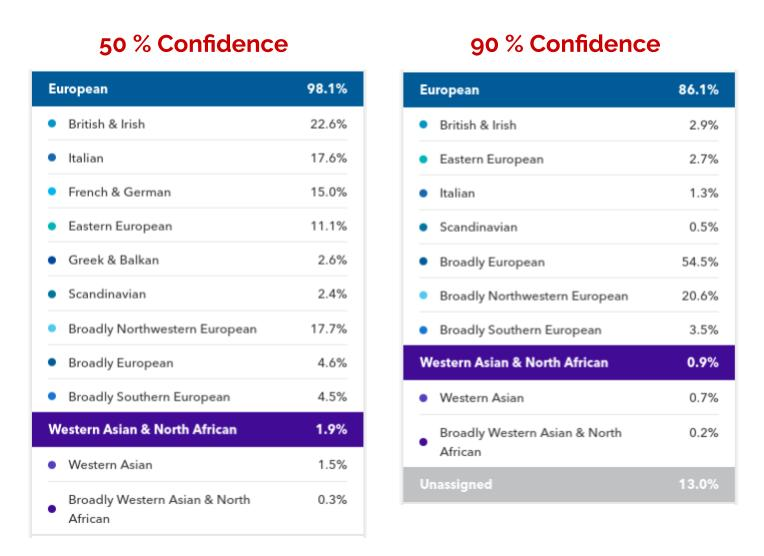
Let’s look at the same report at the default setting of 50% (speculative) and compare it side-by-side with ancestral predictions at the 90% confidence level (conservative).

There are some major adjustments here. Much of the country-level geographic breakdown in the original 50% confidence report is obliterated. In the 90% confidence estimates, the previously larger signals in Italy, the British Isles and Eastern Europe are reduced to blips. The bulk of the ethnicity estimation is shifted out to broad continental-level groupings, with about 75% of the chromosomal segments attributed to origins that are Broadly European and Broadly Northwestern European. For clients interested in highly confident ethnicity predictions, this is the level of resolution that offers the strongest association of DNA characteristics to geography: the broad continental level.
In the great human family tree, broad groupings at the continental level form the major branches of the tree where populations diverged. These deeply divergent events that separated groups of humans from one another allowed distinctive genetic characteristics to accumulate over time. These deeply distinctive genetic characteristics are readily detectable by the types of markers and methods used by ancestry testing companies today, and result in predictions with the highest confidence. Generally, as more specific geographic predictions are attempted–at the regional, country, and local levels–confidence in those predictions decreases. This is due to increasingly extensive DNA sharing between groups.
Differences in ethnicity confidence reports
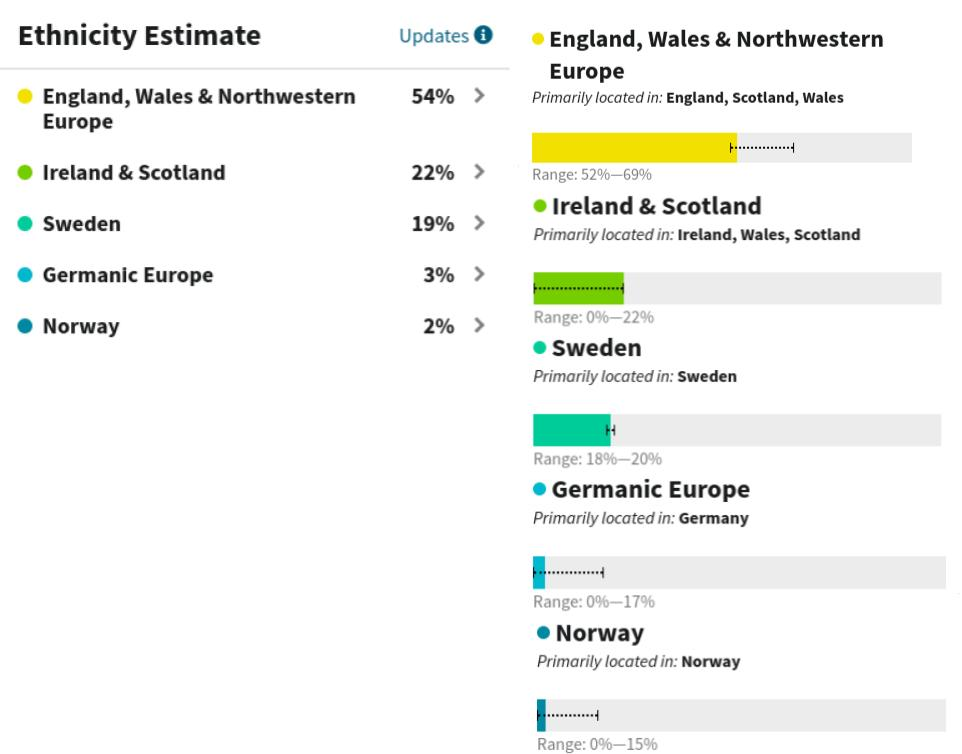
Confidence statistics are generated for all ethnicity reports at all companies, not just 23andMe. AncestryDNA uses a different statistical approach for analyzing the DNA at the outset, and their confidence figures are calculated and displayed in a different way. Confidence statistics are shown as ranges for each of the following predicted populations:

In my report above, AncestryDNA reports 54% England-Wales-NW Europe, but a click on the details arrow shows the confidence interval associated with this figure. The 54% on the initial report is the most likely proportion in a range of numbers that are also likely, in this case 52%-69%. In plain English, they predict that I am 54% English but it’s almost as likely I could be anywhere from 52%-69%. For my Ireland/Scotland figure of 22%, the confidence interval shows it’s almost as likely I could be anywhere from 0%-22%. That should give me some pause on how much credence I lend to that 22% Ireland/Scotland prediction. My 19% Swedish estimation is actually part of a very narrow range, 18%-20%, which tells me that this was a strongly consistent finding among evaluations the algorithm performed on my DNA. Nice.
For the other two minor findings in Germanic Europe and Norway, the confidence ranges suggest that it’s nearly as likely to be 0% as something else much larger, so there’s at best loose confidence in either of these predictions. Awareness of these confidence ranges gives me a measure of discernment to help me evaluate the weight I should give the numbers in my ethnicity report.
Shades of meaning are more powerful
Does it seem like bad news that we can’t just take the numbers in our ethnicity reports at face value? I would argue that it’s great news, that with this awareness comes power. Armed with an understanding of how these confidence figures play into an ethnicity report, the client can choose the level of meaning they draw from the numbers reported to them. If a client is only comfortable with conservative predictions, it’s their choice to give the highest regard to the 90% confidence 23andMe report.
If a client is feeling a bit more plucky and would like to see what interesting signals can be coaxed out of their DNA, albeit with a known lower level of confidence, they can choose to view those more speculative results as another clue, perhaps in tandem with other information from traditional methods, in the greater picture of their family history. And clients who experience some initial bafflement with the minor geographies detected in their reports may be able to access confidence data that shows that 0% may have been nearly as likely as the low percentage that was initially reported to them, and put those minor findings into context. It’s all about choices and power for the client! Now if we could just get the companies to pitch it that way…
 The next topic in this series: how the companies decide which geographic populations they support in the first place, and how that can help you further interpret the results on your ethnicity report. You can read this series from the beginning, too.
Don’t stop here!
There’s a lot more information on your ethnicity that you can learn. Get our free downloadable guide to exploring your DNA ethnicity results.

