The reference panels or populations that inform your DNA ethnicity reports for family history ALSO affect variations in those reports. Here’s what you want to know about this!
This is the fourth in a series of detailed articles on understanding DNA ethnicity by Jayne Ekins. Link to earlier articles below!
 Have you ever mixed a bucket of custom color paint at the paint store? You give them a bucket of plain white paint and one of those nifty swatches from the palette display—let’s say, the color labeled “Showstopper Pink.” They put it in that machine that dispenses the exact amount of several primary color dyes that formulate that special shade of pink you’re going to use in your dining room. The machine shakes it up rather violently for a couple of minutes, and then it’s yours to take home to get that bold new look splashed on your walls.
It’s that formula of quantities of those primary dyes that come together to make your unique shade of Showstopper Pink that are interesting to me today. There’s a big shot of magenta in there, a little bit of black to darken it ever so slightly, and a modest micro-shot of green and yellow to give it a hue that distinguishes it from even its closest neighbors on the palette wall, “Unicorn Rose” and “Sugar Rush Rouge.”
DNA ethnicity estimates: Reporting the mixtures
In the world of ethnicity estimation, let’s think of ourselves for a moment like a bucket of custom paint. Unless you have an identical twin, there’s no other bucket out there that’s the same color as you. Even compared to your siblings, you may have inherited an extra shot of Italian DNA (that by random chance they didn’t get) that makes your bucket totally unique. The major task of an ancestry testing company is to take your thoroughly mixed-up, nuanced blend of primary colors and analyze it, breaking it down to its component parts to give you a report of the formula that came together to make you.
Instead of a report of 4 parts magenta, 1 part black, ¼ part green, ¼ part yellow your ancestry report looks like this:
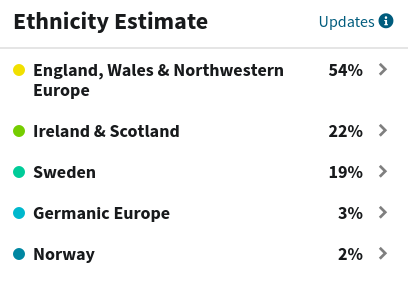
The company broke down and quantified the component signals they detected in my mixed-up, nuanced, one-of-a-kind DNA profile. It’s pretty amazing we can learn all of this from a bucket of paint—or rather a vial of saliva—don’t you think?
Some of the trouble comes, though, as clients see that results differ between companies, or across updates that companies make internally from time to time. They find that the report of their component parts can vary substantially, and it rattles their confidence in the whole process. I know I’m the same Showstopper Pink I’ve always been even though I’m getting some pretty incongruent ethnicity estimations, so how can I see such wild swings from report to report and still feel like I can get behind this science?
Imagine you needed a second bucket of Showstopper Pink and when you went back to the paint store they told you they had just overhauled the way they make the primary colorant dyes. Their fundamental definitions of magenta, black, green and yellow have all changed. Each of the primary dyes they’re using now has a modified color profile compared to the ones you used to make your original bucket of paint. They can still match your original custom shade, but the numbers in the formulation will be totally different:
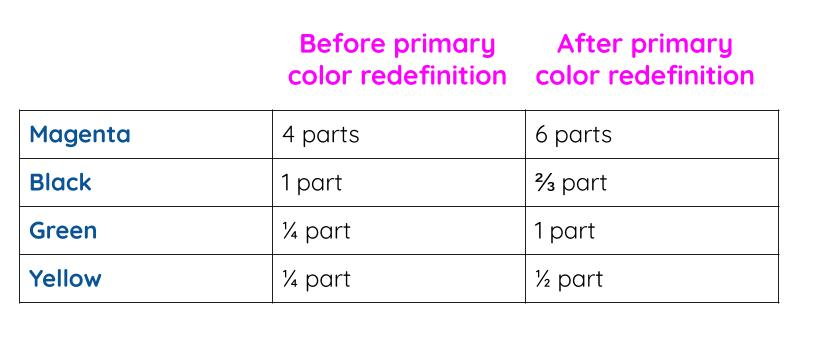
The quantities of the contribution of each color are different of necessity due to the change in the essential definition of the dyes. But I can still get my matching bucket of paint, so that’s OK with me.
DNA ethnicity and reference panels
When it comes to ethnicity estimation however, we may not have such a loose tolerance for our numbers changing up. And that’s OK, too. It is helpful to understand, though, that one of the major factors that influences these varying estimations between companies, and between internal version updates, is that the essential definition of the genetic characteristics for the geographies they support are different.
One of the first steps in developing an ethnicity estimation process is to define a reference panel. This is the a set of real-life individuals who are identified as being typical or definitive for a single population of interest. Then all of us, the clients of “unknown” origin can be compared to the genetic characteristics of each reference population to decipher our own unique mix of ancestral origins that have come together to make our DNA today.
So how do ancestry testing companies find these real-life individuals who define their reference populations? What criteria do they use to determine if they are typical of the population they are studying? How many individuals do they need in their reference populations to make meaningful predictions? Great questions. I’m so glad you asked.
Identifying reference populations
To make their reference populations, DNA companies are looking for people whose ancestry comes from a single location. They want to avoid including individuals that are admixed, meaning their ancestry comes from several different geographies, because at the outset they want to be able to survey genetic characteristics that represent as strict a representation of a single location as possible without any outside infiltration. There are some DNA collections available to scientists that were assembled from many world-wide populations in the early 2000s that companies include as part of their reference panel. Then they also turn to their own participant database to find more people who originate from a single ancestral population.
The initial criteria generally used by companies to identify candidates for their reference panel is that all four grandparents originate from the same non-colonial geography (not USA, Australia, etc). DNA companies also survey participants for trans-national identifications that are important for distinct ethnicities that can form their own genetic populations separate from geography of origin (i.e., Ashkenazi Jewish, Cherokee, Basque and others). For some ancestral populations, the lack of even very recent records means that participants may not be able to document their grandparents. In these limited situations, just the birthplace of the participants themselves are used to identify them as a candidate for membership in the reference panel.
Following the initial identification of these samples, companies use several refinement steps to ensure the highest quality possible for the composition of their reference panels. First they filter out all but a single representative of closely related families, as closely related people would skew the genetic characteristics of the reference population to overly represent a certain specific lineage within a region. Next they use a statistical method called Principal Component Analysis (PCA) to identify individuals that are outliers from the rest of their geographic group.
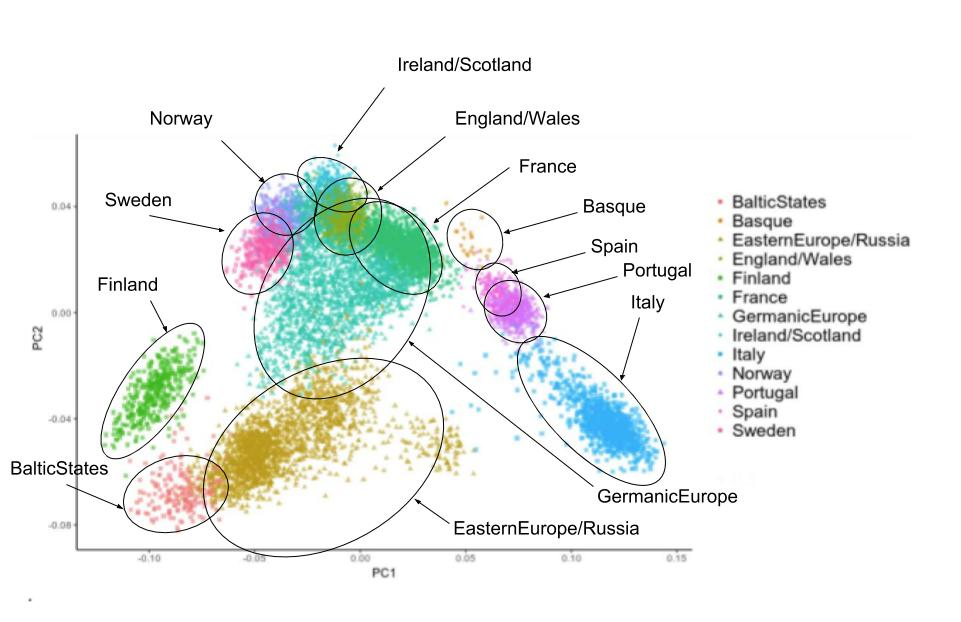
This PCA visual plot from AncestryDNA is interesting to examine. Each colored point represents a person who is a candidate for their reference population for a certain region in Europe. Remember that all four grandparents for each of these people have the same geographic origin. It’s possible to recognize individuals who cluster closely with others from their same ancestral origin, and some that look as if they are a less typical representative. For example, many of the gold points that make up the Eastern Europe/Russia sampling group together, but there are some outliers that fall solidly within the Germanic Europe cluster. This is a case where the genetic characteristics of an individual are at odds with the reported ancestral origin, so these individuals are eliminated from the reference panel. Groups of individuals in each geography are subjected to further refinement in more tests that we’ll discuss in depth in my next article.
The final product is different for each company, but represents a collection individuals from a single ancestral origin whose genetics are consistent with others exclusively from that same region. No two companies share the same set of individuals so their reference panels may well represent a different shade of genetic character that may be found within a single geography. The coverage of sampling may also vary significantly from company to company.
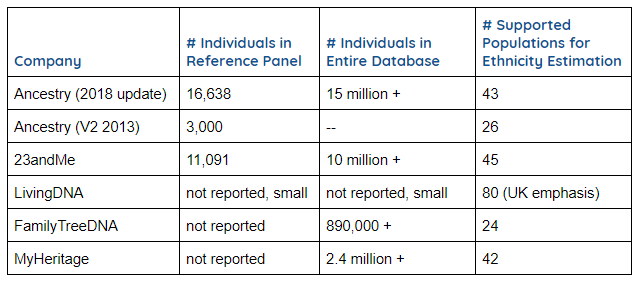
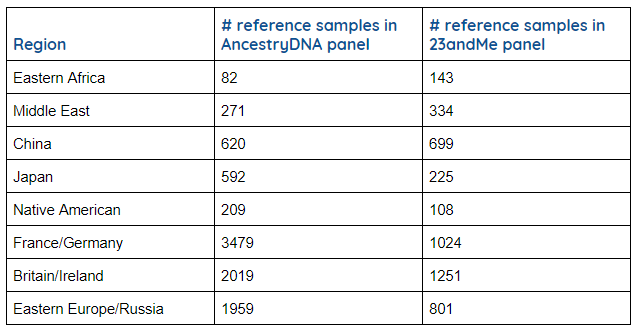
This table provides database characteristics for each company that speaks to the sampling coverage represented by the reference panels used for ethnicity estimation. Generally, a larger sampling representing a reference population is preferred to a smaller sampling for making robust predictions of ethnicity for clients. AncestryDNA and 23andMe are the only companies that publish specific numbers for the composition of their reference panels. They support a similar number of populations, but AncestryDNA does have 50% greater coverage for the overall representation of their reference panel compared to 23andMe. LivingDNA, FamilyTreeDNA and MyHeritage do not report the number of samples in their reference panel, but their overall database sizes are smaller so it is likely their reference panels have a smaller number of representatives as well, compared to the larger databases.
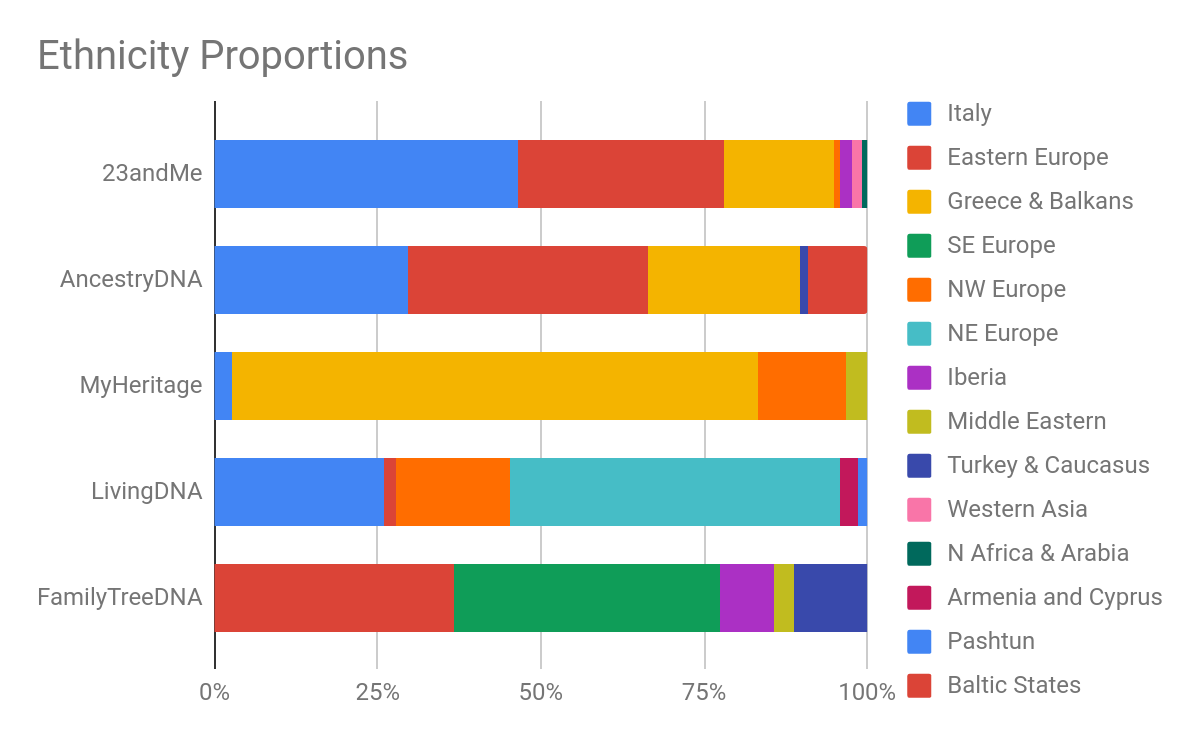
In the first article in this series we looked at CBC reporter Charlsie Agro’s test results from these five companies. All five reported different findings, but AncestryDNA and 23andMe were actually fairly comparable. This is just a single case study, of course, but it does support the idea that the reference panels that are based on a greater sampling size perform more consistently for clients.
AncestryDNA and 23andMe are also the only companies that publish the composition of their reference panels, with details of how many reference samples support each population (click here for Ancestry’s and here for 23andMe’s full documentation of their reference panel numbers and composition. The table below is a small representation of the world-wide populations each company supports, with the number of samples in each reference panel for each company for comparison.
A fundamental truth about DNA ethnicity definitions
Remember when we were trying to match our original bucket of Showstopper Pink paint? When the paint store changed the fundamental definitions of the dyes, the proportions of each colorant used to formulate the custom paint changed. This is similar to what clients are experiencing when they observe differing results in their proportion of ancestral regions between different companies, and among internal updates to reference panels that all companies will do from time to time. The fundamental genetic definitions for each of the geographies is different. Each company has its own proprietary collection of reference samples for the populations they support with samples that are probably largely unique to the company, and the numbers that support each population can vary widely.
And with these varying reference panel definitions, not unexpectedly come results that can also vary, as Charlsie Agro observed—and maybe you have, too. Never fear, take some of the concepts from this article to aid in your interpretation of which set of results to give the most weight. For starters, I’d go with the company that has the strongest sampling numbers for the populations they are reporting for me. And be sure to tune in next time as we’ll be exploring more of the companies’ own internal validations for their reference panels, which can further help you know where to throw your grains of salt when you’re evaluating your ethnicity results. This is going to be fun!
What do your ethnicity results mean for you?
Interested in more insight on what your ethnicity results mean? Check out our Ethnicity FAQs and also download free guide on DNA ethnicity estimates.
Show me that free Ethnicity Guide!
Next in this series: Which DNA testing company’s ethnicity estimates are the best? Jayne has answers.

