Ethnicity estimates in DNA testing are becoming more precise, accurate and consistent—but they’re still not equally robust across the market. Here’s an expert (and detailed) answer to this important question!
DNA ethnicity estimates: Performance varies
This article is going to teach you how to be a next-level consumer of the offerings for genetic autosomal ethnicity tests that are on the market today. The public suspects this, and the internal validations of ancestry testing companies back up the idea as well: the performance of ethnicity prediction tests are not equally robust across the market. Performance varies from company to company, and importantly is not uniform for all populations even within a single company’s genetic ethnicity panel.
This is relevant information to potential clients, because as a discerning consumer you may choose to use one company over the others depending on the performance statistics for particular ethnicities that are applicable to you (i.e., if you’re interested in specifically querying for Nigerian ancestry, you may not want to choose a company that has tepid performance measures for this region). Perceptive clients may also use the same measures to help interpret their genetic ancestry reports, using the knowledge of regionally specific performance to give weight to the validity of the predictions they receive.
Sorting DNA ethnicities: An M&M analogy
We’re going to get to the specific performance measures that are indicators of the robustness of the ethnicity estimation process, but first we have to talk about M&Ms and specifically a mythical M&M sorting machine. It’s powered by state-of-the-art software, precision robotics and a highly-tuned optical detection system. Top of the line. And it’s only job is to sort M&Ms by color into neat little piles. Haven’t you always wanted one of those? You pour a bag of entirely mixed up M&Ms into an opening in the top, and one by one it groups each delectable candy morsel with its same-color comrades on your table top. Let’s check out the results.
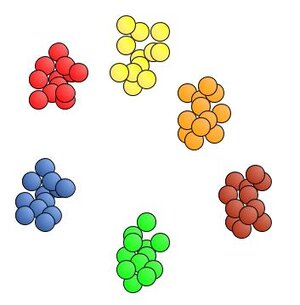
The piles are nice and neat, all the colors are pleasingly grouped. Very nice. I give that M&M sorting machine an A+ for performance.
Even though this first run delivered a perfect performance, the machine may not always get it right. There are two different ways we’re interested in today that describe how the performance in recognizing the color of the M&Ms can decline. A statistician watching this process would use the terms precision and recall to measure how well the machine identifies the correct color of each M&M. To start with, we’re going to designate a scenario where we focus on green as the troublemaker color. Here’s the next run of our M&M machine:
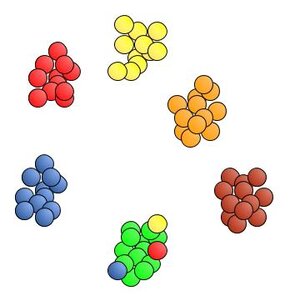
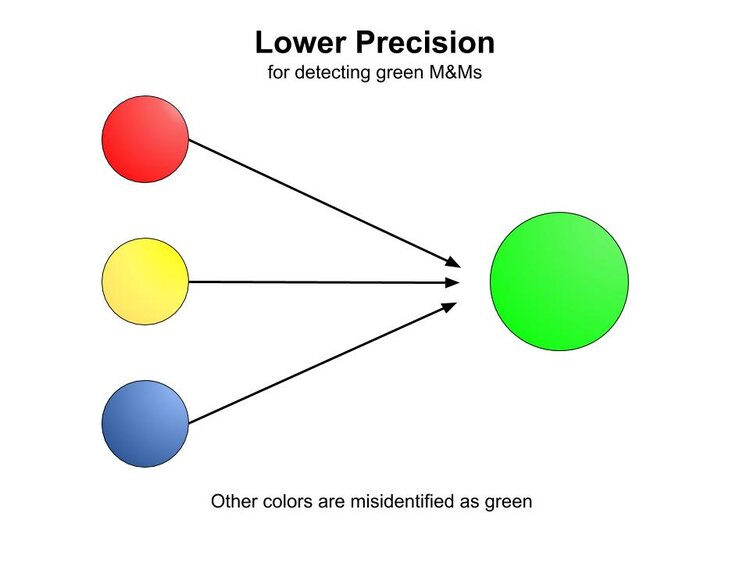
It looks like the machine didn’t get it quite right this time. All of the M&Ms ended up in the right pile, except for a stray red, yellow and blue that were all grouped with the green pile. The machine mistook the color of these errant M&Ms as green. This is a scenario that exhibits lower precision for detecting green M&Ms than in the initial perfect run. When other colors are misidentified as green, the performance of the machine is said to have lower precision in correctly recognizing green M&Ms. [Precision is a term that is explicitly calculated and expressed as a percentage. In the first perfect run precision and recall are both 100%. In this second run, the number of greens were overestimated so there is lower precision for green. The machine identified 15 greens, but there were only 12. Precision = 12/15 = 0.80 = 80%.]
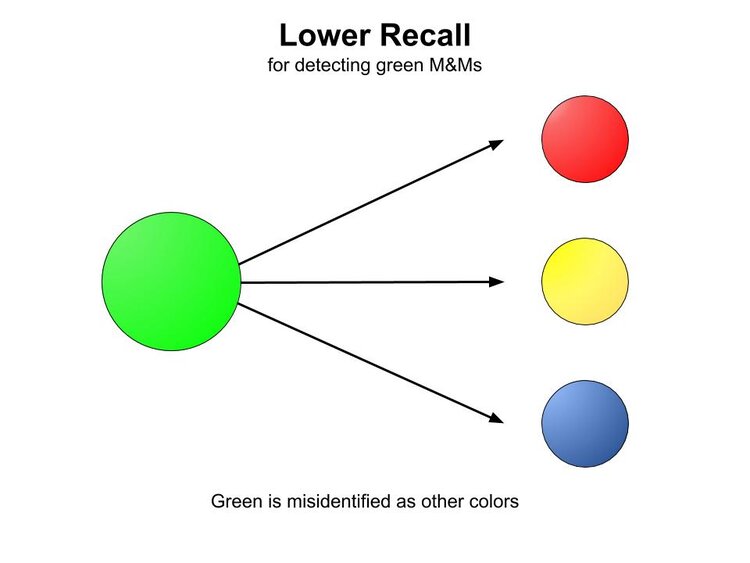
A somewhat converse experience can occur as well, where green M&Ms can be mistaken for other colors.
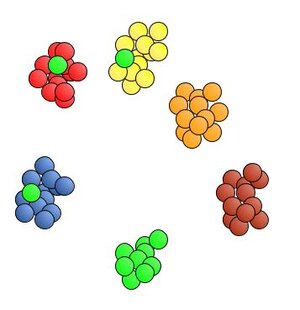
When M&Ms that are green are misidentified as a different color, the performance of the machine is said to have lower recall for green. [Recall is also expressed as a percentage. The number of greens in this run were underestimated, so the ability of detecting green exhibits lower recall. The machine identified 9 greens, but there were actually 12. Recall = 9/12 = 0.75 = 75%.]
Precision and recall are not just useful for evaluating piles of M&Ms, but are utilized heavily in assessing the efficacy of ethnicity estimation processes. Among other measures, they can give a valuable snapshot of how well the process performs on a case-by-case basis across the different populations the companies support.
There are variations in the exact methods that companies use to extract these indicators from their data, but they begin with a collection of individuals with known and unmixed ethnicity to test each of the genetic populations supported by its reference panels. Since by definition these known individuals are from a single population, a perfect performance of the ethnicity estimation process would assign them 100% into their original population. This is not always the case, and the companies closely evaluate the nature of the misassignments using precision and recall statistics, as this gives an indication of how their process would be expected to perform for commercial clients.
Just like the M&M example above, populations that are prone to misassigned individuals exhibit this tendency in two ways. If we are interested in examining the performance of Sweden in ethnicity estimation, lower precision would manifest with the individuals that are known to be from other nearby countries (say Denmark, Norway or Finland) being assigned to the Swedish cluster.
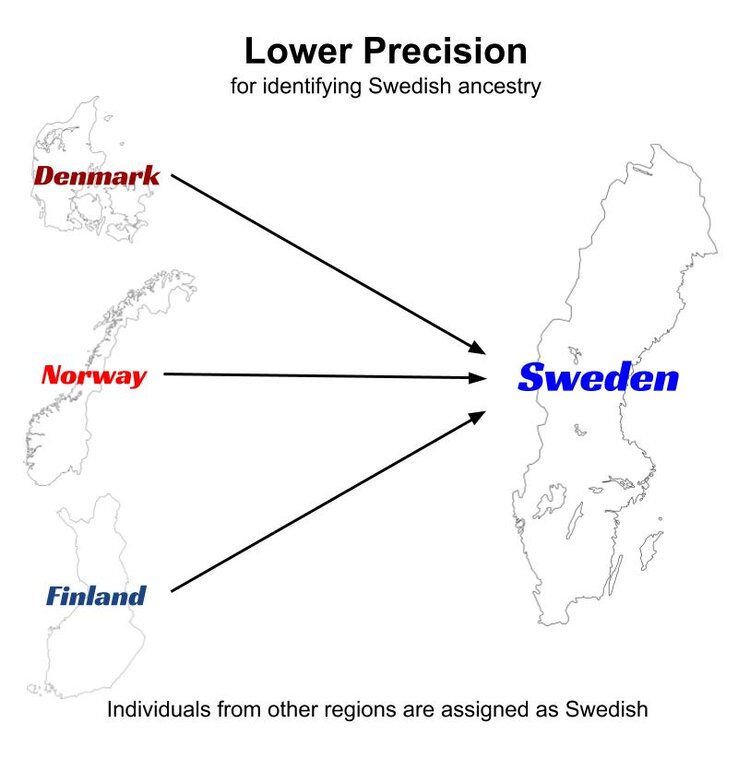
Misassignments do not necessarily always happen between adjacent regions, but this is often the case.
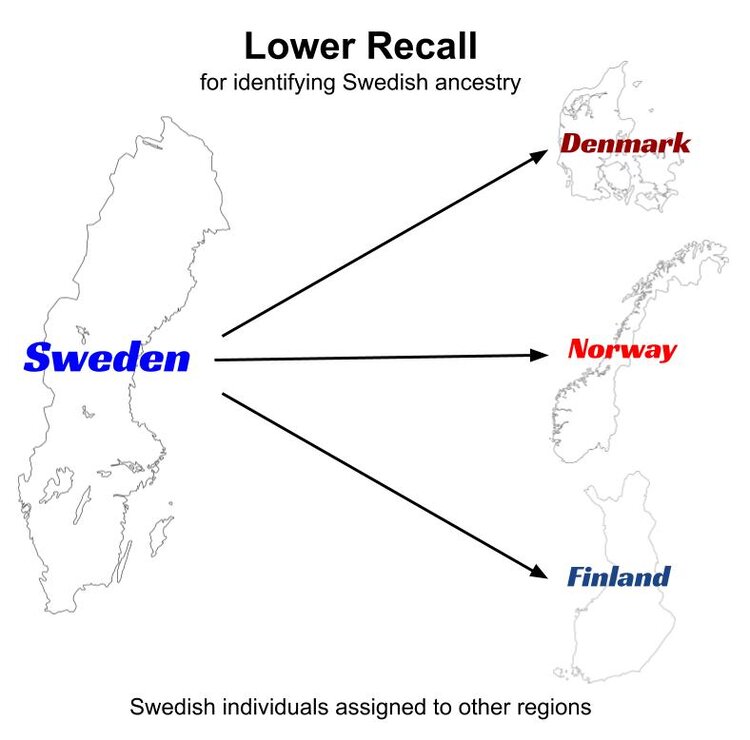
In the case of lower recall for Sweden, individuals that are known to be from Sweden are misidentified as having ancestry from other regions (perhaps Finland, Norway or Denmark).
In the course of this validation process, the companies may go through many iterations of testing where they merge regions that consistently and reciprocally misassign test individuals, split other regions that show genetic distinctness, and otherwise redefine geographic boundaries for their proposed genetic populations (i.e., AncestryDNA currently combines NW Continental Europe and England into a single genetic population. This is at least in part due to low precision and recall obtained in internal validations when attempting to split those regions into autonomous genetic groups). Precision and recall measures, among other tests, guide each round of evaluation until they come to an arrangement where the statistics indicate that the ability to detect true genetic ancestry is maximized, given the characteristics of the reference panel.
The output from these rounds of testing is complex, and precision and recall numbers are used heavily to sort out the success or problems with each region. In contrast to our first M&M examples where most colors were nicely sorted together in their target pile, much of the output from these testing runs can seem thoroughly mixed up at first glance, requiring some tenacity to detect underlying trends.

In the case of a perfect run where the colors of all M&Ms are identified correctly, precision and recall are both 100%. With this more convoluted output where many M&Ms are misidentified, precision and recall both decline and can be explicitly calculated.
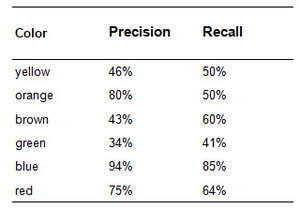
Visual inspection supports the trends that show up in the numbers. Blue looks pretty solid. There’s only one yellow in the blue pile so it exhibits high precision (94%), and there are just a few blues that went out to the green pile so the recall (85%) is also high. The machine’s performance with identifying green is poor as it consistently categorizes other colors as green (low precision, 34%), and also frequently mistakes green for a different color (low recall, 41%). Orange is an interesting case as it performs with higher precision (80%) since its pile consists of mostly solid orange, but recall (50%) is much lower because orange was often misidentifed as green, brown and yellow.
These same types of observational methods can be applied to the output of ethnicity prediction algorithms. When the algorithm designates a cluster of test samples as Swedish and most of these test individuals truly are from Sweden (not Denmark, Norway or otherwise), the performance of the process shows high precision. And when most of the Swedish samples available were actually assigned to the Sweden group (rather than mistakenly assigned to Finland, Norway or elsewhere) the algorithm is said to exhibit high recall.
So the burning question is, “What precision and recall statistics are available for each of our genetic genealogy testing company’s reported ethnicities?” There ARE some—and once you see them, you’ll be clamoring for more. Read the answers here in this follow-up article.
Don’t miss out on our other ethnicity estimate information. We put together our best tips and tricks for understanding your DNA ethnicity results into one handy guide, free for you to download!


