This new article series by genetic genealogist Jayne Ekins deep-dives into DNA ethnicity estimates and explains why they vary so widely.
Were you the victim of an ethnicity overhaul when AncestryDNA updated their process in 2018? Perhaps you’ve tested with different companies and find that your results are all over the map, so to speak. How can this high-tech scientific process tell me I’m 3.7% Swedish when I know my family hasn’t so much as set foot in IKEA?
When a client hires an ancestry testing service, they don’t expect to be baffled by the results. We don’t typically think of needing support to interpret the answers we get from other lab tests: strep throat negative, blood type O-, paternity positive. For most of us, our other personal interactions with scientific labs have been definitive and straight forward. So why does it seem like ancestry testing doesn’t provide the cut-and-dried, in-the-bag, indisputable experience that we might expect of it?
Test Case: DNA Ethnicity Varies–Even Between Twins!
In January 2019, CBC reporter Charlsie Agro published her ethnicity estimation results from five different ancestry testing companies. She began this undertaking expecting to see some Italian ancestry, and definitely didn’t expect the wildly different figures that came out of each company’s pipeline. To compound the intrigue, her identical twin sister also took the same ancestry tests. Surely these scientific processes would produce the same results for twins who have identical DNA, but this was not the case.
This style of graph is a way of showing how similar ethnicity estimation reports are between companies. In the first graph is theoretical data that I created to demonstrate what it would look like if each company produced results roughly similar to one another.
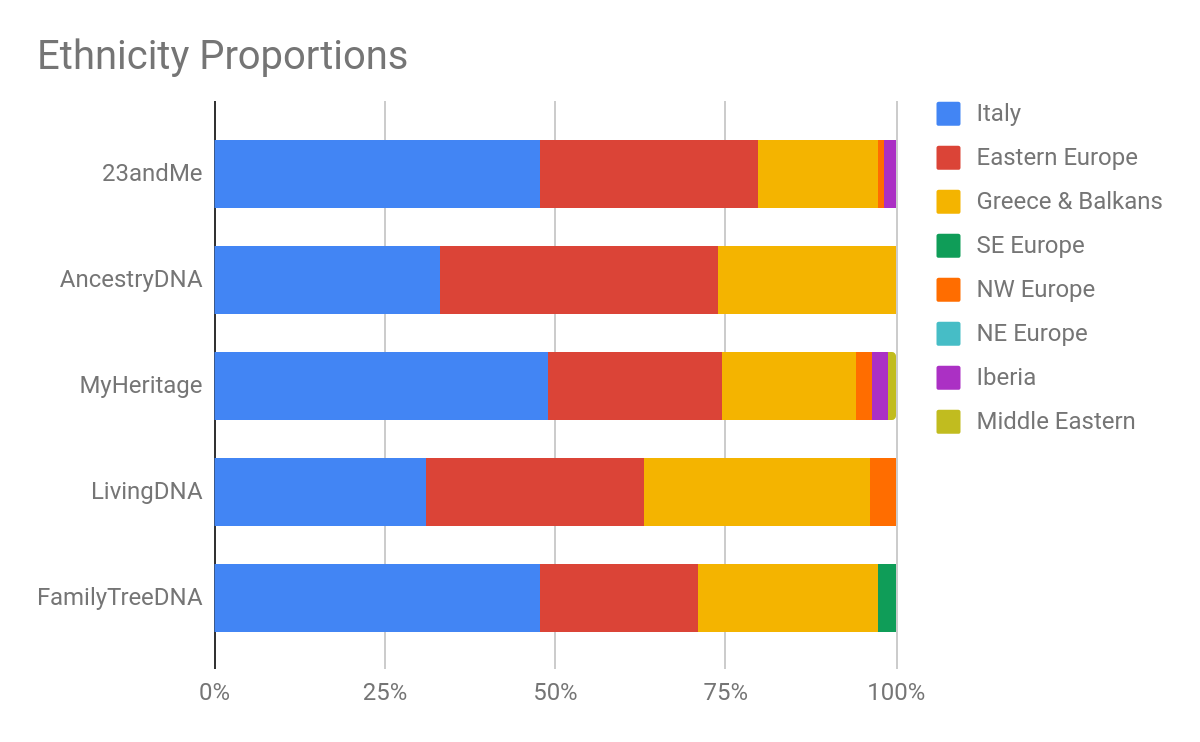
In this idealized simulated data, each company reports relatively large proportions for the same geographies: Italy, Eastern Europe, and Greece & Balkans. There’s some variation with the minor geographies that were detected from company to company, but overall there is a consistent story of comparable ethnicity proportions from the same populations.
For Charlsie Agro’s testing experience with five different companies, the actual results were far less consistent:
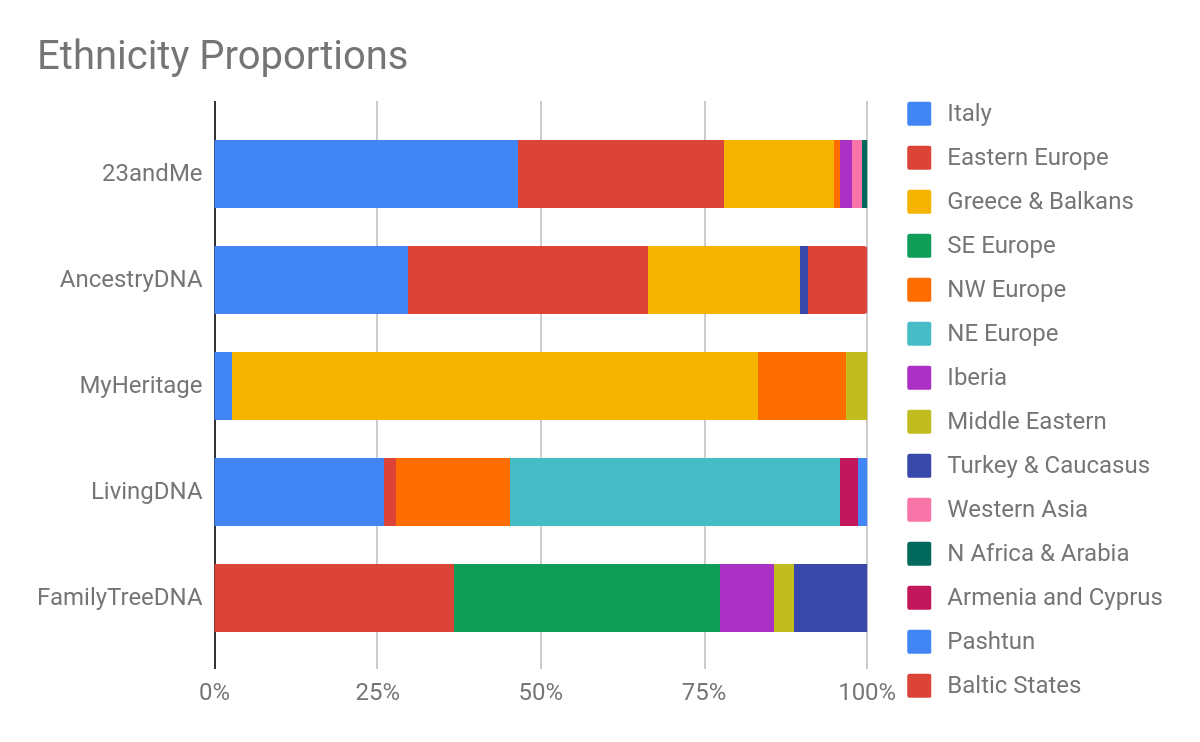
The ethnicity estimations of 23andMe and AncestryDNA are the most similar, with comparable proportions in the same major populations: Italy, Eastern Europe, and Greece & Balkans. They report different signals for the minor geographies they detected, but there is overall coherence in their independent findings. In contrast, MyHeritage reported over 80% ethnicity in Greece & Balkans, with just 2.8% in Italy, and Eastern Europe is not found at all. Living DNA does detect a strong Italian signal, but reports nothing from Greece & Balkans, with the strongest signal coming from NE Europe. Family Tree DNA does detect Eastern Europe like many others, but its strongest signal is only specified by SE Europe. It’s possible this could include the Italy and Greece & Balkan ethnicity found in other tests, but it is such a broad category that it is difficult to interpret.
Why DNA Ethnicity Varies
These results were baffling enough to Charlsie Agro that she consulted the companies and other independent scientific groups in an attempt to explain why their processes could produce such wildly varying results. The reports of her twin sister, while expected to be the same due to their identical DNA, also showed unanticipated variation. The implication of this small case study was that ethnicity estimations at large could all be suspect.
So how do you reconcile these unexpected results? Is this the product of junk science–figures that are contrived or processes that are less than rigorous? Is there any meaning to be found in the results, or is it time to throw the baby out with the bathwater when it comes to any kind of ethnicity testing? Do you think this will get better in time as companies refine their methods and expand their sample base? Is it possible that we might expect differences in ethnicity results from company to company, even among identical twins?
If you are ready to get to the bottom of these questions, keep reading this deep-dive series into the black box of ethnicity estimation. We will bring you an understandable exploration of how companies arrive at the figures they report to you, helpful lenses that you can use to interpret results, and specific information on the state of the art of ethnicity genetics today with help to understand its limits, and a vision for where it is headed in the future. Buckle your DNA seat belts!
More ethnicity tips
Don’t let your DNA ethncity learning stop here! Continue on with our free guide to understanding your ethnicity results.

